
How to Read Matka Charts Like a Pro
How to Read Matka Charts Like a Pro
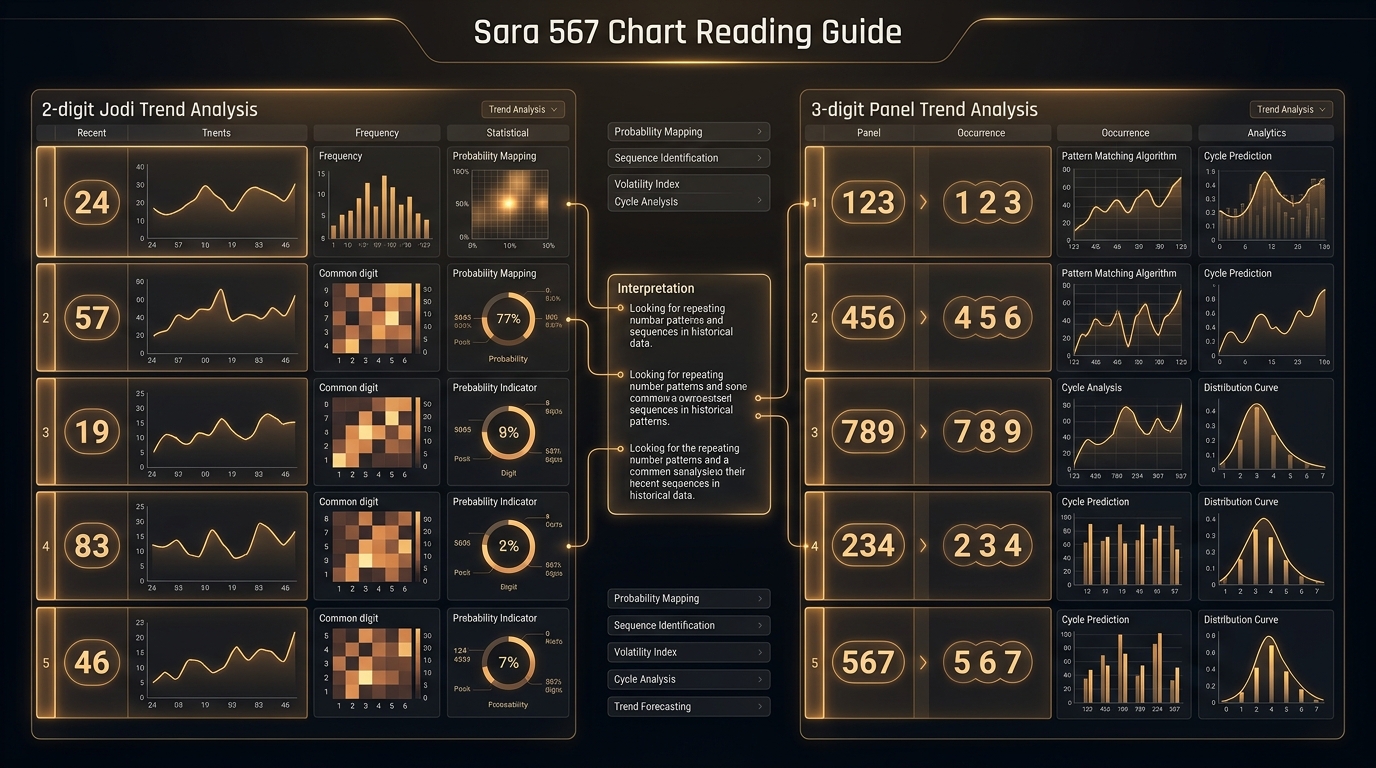
When newcomers first look at a Satta Matka chart, they often see a dense wall of numbers, three-digit sequences, and two-digit pairs organized into a massive matrix. Without understanding the underlying structure, navigating these historical archives can feel confusing and intimidating.
However, professional Matka analysts do not see random digits; they see an organized timeline of market history. Matka charts are structured databases documenting the chronological outcomes of daily market sessions across weeks, months, and years.
If you have already read our Complete Beginner's Guide to Satta Matka, you know the fundamental concepts of Single, Jodi, and Pana. In this comprehensive guide, we take the next step and teach you how to read matka charts like a pro — breaking down the structural anatomy of Jodi and Panel records, interpreting weekly grids, and extracting valuable historical insights on Sara 567.
The Anatomy of a Matka Chart: Rows, Columns, and Cycles
Every standard Matka chart follows an organized calendar grid layout. Understanding the grid coordinates is the first step to effortless chart reading:
- Columns (Days of the Week):
- The top header row represents the days of the week, typically arranged from Monday to Saturday (or Sunday for 7-day markets like Kalyan Night and Milan).
- Each column represents that specific day's market declarations.
- Rows (Calendar Weeks):
- Each horizontal row represents an entire calendar week of operations.
- The newest weekly row appears at the bottom of the table, while older weeks sit above it chronologically.
- Cells (Daily Results):
- The intersection of a week row and day column represents the declared outcome for that market day.
Jodi Chart vs. Panel Chart: What Is the Difference?
In platforms like Sara 567 Charts, every market maintains two distinct chart types: Jodi Charts and Panel (Pana) Charts. Choosing the right chart depends on the depth of information you need.
1. Jodi Charts (Macro Overview)
A Jodi Chart displays only the two-digit pair (00 to 99) declared for each day.
- Visual Style: Clean, compact, and easy to scan at a glance.
- Primary Use: Tracking weekly number trends, identifying repeat digits, and examining high-level jodi frequency patterns over several months.
- Best For: Fast reference when you only need to verify which pair was declared on a specific weekday.
2. Panel Charts (Micro Breakdown)
A Panel Chart (also called a Pana Chart) provides the complete three-part mathematical record for every single session.
- Visual Style: Each day cell contains three distinct entries: the 3-digit Open Pana, the 2-digit Jodi, and the 3-digit Close Pana.
- Primary Use: Deep mathematical analysis, verifying the exact 3-digit combinations drawn, and studying how individual panas sum into the middle jodi.
- Best For: Serious players and analysts who analyze Single Pana, Double Pana, and Triple Pana occurrences.
Quick Comparison: Jodi vs. Panel Chart
| Feature | Jodi Chart | Panel (Pana) Chart |
|---|---|---|
| Data Shown | 2-digit Jodi only (00 - 99) | Open Pana (3 digits) + Jodi (2 digits) + Close Pana (3 digits) |
| Grid Complexity | Low (Compact & Clean) | High (Comprehensive & Detailed) |
| Layout Example | 48 | 158 - 48 - 279 |
| Primary Goal | Macro trend & pair pattern overview | Micro pana cycle & frequency analysis |
| Explore on Sara 567 | Kalyan Jodi Chart | Kalyan Pana Chart |
Step-by-Step: How to Read a Panel Chart Cell
Let us examine a real-world cell from the Kalyan Panel Chart to understand exactly what each number signifies:
$\begin{array}{|c|} \hline \mathbf{148} \ \mathbf{38} \ \mathbf{279} \ \hline \end{array}$
Here is how to decode this three-tier entry:
- Top Number (
148) — Open Pana:- The three digits drawn during the market's initial Open session.
- Notice they are written in ascending order ($1 < 4 < 8$).
- Adding them together: $1 + 4 + 8 = 13$. The unit digit is 3.
- Middle Number (
38) — The Jodi:- The two-digit outcome.
- The first digit (
3) matches the Open Ank ($13 \rightarrow \mathbf{3}$). - The second digit (
8) matches the Close Ank ($18 \rightarrow \mathbf{8}$).
- Bottom Number (
279) — Close Pana:- The three digits drawn during the market's Close session ($2 < 7 < 9$).
- Adding them together: $2 + 7 + 9 = 18$. The unit digit is 8.
By reading from top to bottom, you immediately comprehend the entire session lifecycle: Open Pana (148) $\rightarrow$ Open Ank (3) $\rightarrow$ Close Ank (8) $\rightarrow$ Close Pana (279), producing the final market statement: 148-38-279.
Common Matka Chart Patterns Explained
When analyzing historical charts on Sara 567, you will encounter several recurring terminology concepts:
1. Cut Numbers (Family Numbers)
In traditional Matka arithmetic, each digit from 0 to 9 has an opposite "cut digit" calculated by adding 5 (modulo 10):
1and62and73and84and95and0
When an analyst studies a chart, noticing that 3 and 8 alternate frequently indicates a cut-number cycle.
2. Family Jodis (Full Sangam Sets)
A Jodi family consists of eight interrelated pairs sharing the same base and cut numbers. For example, the family of 12 includes 12, 17, 62, 67, 21, 26, 71, and 76. Chart analysts track which families have made recent appearances across weekly cycles.
3. Red Jodis (Lal Jodi)
A "Red Jodi" occurs when both digits in a pair are either identical (e.g., 11, 44, 99) or complementary cut digits (e.g., 16, 61, 27, 72). These are often visually emphasized because they indicate matching or mirror session totals.
How to Analyze Charts Responsibly on Sara 567
While learning to read charts sharpens your analytical skills, it is critical to maintain a realistic, responsible perspective:
- Charts Record the Past, Not the Future: A Matka chart is an accurate historical ledger. While patterns exist in retrospective data, random chance governs every new draw. No mathematical formula can predict tomorrow's draw with certainty.
- Avoid the Gambler's Fallacy: If a specific number has not appeared for three weeks, it does not mean it is "due" to appear tomorrow. Each session draw remains statistically independent.
- Leverage Clean Digital Tools: Always use reliable platforms like Sara 567 that update without typographical mistakes or missing dates. Corrupted data leads to flawed analysis.
- Follow Responsible Play Principles: Set strict personal limits, never wager beyond your disposable entertainment budget, and review our disclaimer & terms before participating.
Frequently Asked Questions (FAQs)
1. How often are Matka charts updated on Sara 567?
Charts on Sara 567 update immediately as soon as an official market session declares its Open or Close result, ensuring you always review up-to-the-minute records.
2. What is the difference between a Single Pana and a Double Pana on a chart?
A Single Pana consists of three unique numbers (e.g., 148), while a Double Pana has two repeating numbers (e.g., 227). Both appear in the top or bottom slot of a Panel chart cell.
3. Why are numbers written in ascending order in panas?
By convention, digits in any Pana are always recorded from lowest to highest (e.g., 2-5-8 instead of 8-2-5) to maintain consistency and simplify chart indexing.
4. Where can I find the Kalyan chart?
You can view both the Kalyan Jodi Chart and the Kalyan Pana Chart directly in our dedicated charts section.
5. How far back do the historical charts go on Sara 567?
Sara 567 archives extensive historical records spanning past months and years, allowing researchers to study multi-season market trends.
6. Is there a mobile app to check charts on the go?
Yes. You can access all charts seamlessly on mobile browsers or install our official APK via the how to play page.
Continue your learning journey by exploring our Complete Beginner's Guide or browse the live data in our Charts Archive.