
Advanced Matka Chart Analysis Techniques
Advanced Matka Chart Analysis Techniques
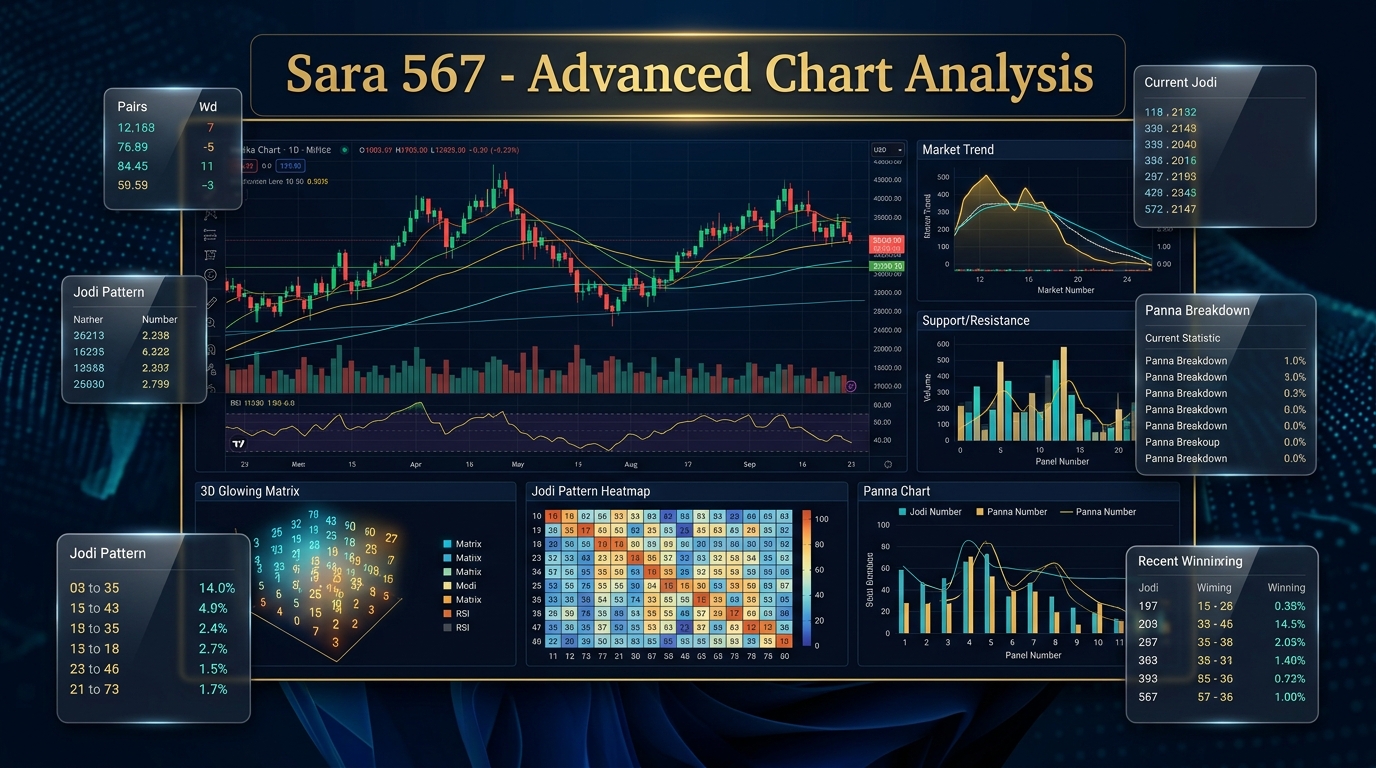
While beginner players often view market records simply as past outcomes, experienced analysts treat historical records as rich data ledgers. By examining long-term variance, digit distributions, and symmetrical groupings across Matka Charts, analytical enthusiasts can uncover structural insights that remain invisible to casual observers.
Conducting advanced matka chart analysis requires transitioning from subjective guesswork to rigorous, data-driven methodology. By applying disciplined technical chart reading, dissecting panel chart patterns, and executing systematic jodi analysis, users gain a profound understanding of how numbers behave across multi-week cycles.
Following our foundational breakdowns on How to Read Matka Charts, Kalyan Matka Analysis, and Odds & Probability Calculations, this advanced guide explores the analytical frameworks used by serious data enthusiasts on Sara 567.
1. The Analytical Mindset: Data Science vs. Myth
Before exploring specific chart patterns, it is vital to establish the correct philosophical boundary:
- Empirical Observation, Not Fortune-Telling: Technical chart reading is the study of historical frequency, variance, and distributional symmetry. It does not provide "magic guarantees" or psychic leaks.
- Independent Events: Every number draw remains a mathematically independent random event. However, over hundreds of iterations, random distributions conform to predictable statistical boundaries (the Law of Large Numbers).
- Variance and Outliers: Short-term anomalies (such as a digit repeating three days in a row) are normal statistical fluctuations that eventually regress toward the mean over extended timelines.
By approaching charts with an objective, analytical mindset, you insulate yourself from emotional decisions and fraudulent tipster schemes.
2. Decoding Panel Chart Patterns (Technical Chart Reading)
On platforms like Sara 567, the Panel Chart is the most data-dense document available. Unlike simple Jodi ledgers, panel charts display the complete three-digit opening Pana, the central Jodi, and the closing Pana.
┌────────────────────────────────────────────────────────────────────────┐
│                   SAMPLE ADVANCED PANEL CHART LEDGER                   │
├───────────────┬────────────────────────┬───────────────────────────────┤
│ Date / Day    │ Open Pana + Open Ank   │ Close Pana + Close Ank = Jodi │
├───────────────┼────────────────────────┼───────────────────────────────┤
│ Monday        │ 137 → 1                │ 590 → 4   = Jodi 14           │
│ Tuesday       │ 248 → 4                │ 168 → 5   = Jodi 45           │
│ Wednesday     │ 357 → 5                │ 239 → 4   = Jodi 54 (Reverse) │
│ Thursday      │ 112 → 4 (Double Pana)  │ 678 → 1   = Jodi 41 (Cut Pair)│
│ Friday        │ 489 → 1                │ 338 → 4 (Double Pana) = 14    │
└───────────────┴────────────────────────┴───────────────────────────────┘
A. Single Pana (SP) vs. Double Pana (DP) Clustering
- Out of 220 possible Pana combinations in any standard session, 120 are Single Panas (all 3 digits unique), 90 are Double Panas (two identical digits, e.g.,
112or338), and 10 are Triple Panas (111,222, etc.). - Ratio Tracking: Over a rolling 30-day window, Single Panas account for roughly 54.5% of outcomes, while Double Panas represent 40.9%. When an extended cycle produces 10 consecutive Single Panas, analysts note that the probability distribution will inevitably correct back toward the historical 55:41 ratio over larger samples.
B. Columnar Sequence Analysis (Vertical Alignment)
Instead of reading charts solely chronologically (left to right), advanced analysts examine vertical day-of-week trends:
- For example, reviewing every Monday draw across Kalyan over the preceding 12 weeks.
- Tracking vertical repetitions helps identify whether specific opening numbers cluster around specific operational weekdays due to seasonal or shift-based draw conditions.
3. Advanced Jodi Analysis: Families, Cuts, and Cross-Pairs
In Satta Matka arithmetic, digits from 0 to 9 are grouped into complementary mathematical pairs known as Cut Anks:
| Primary Ank | Cut / Complementary Ank | Absolute Difference |
|---|---|---|
| 0 | 5 | ±5 |
| 1 | 6 | ±5 |
| 2 | 7 | ±5 |
| 3 | 8 | ±5 |
| 4 | 9 | ±5 |
The Family Jodi Matrix
A "Family Jodi" consists of 8 interconnected two-digit combinations formed by taking the original Jodi and substituting either the first digit, the second digit, or both digits with their Cut equivalents, plus their direct reverse pairs.
For example, the Family of Jodi 14 includes:
- Base Pair: 14
- Reverse: 41
- Cut First: 64 / Reverse: 46
- Cut Second: 19 / Reverse: 91
- Full Cut: 69 / Reverse: 96
In multi-week trend analysis, an analyst tracks whether a particular Family quadrant is "active." If three members of the 14 family have appeared over a 15-day period, the entire 8-pair set is monitored for dispersion balance.
Red Jodi (Lal Jodi) Identification
A Lal Jodi occurs when either:
- Both digits are identical (e.g.,
00,11,22,33,44,55,66,77,88,99). - The Jodi consists of a primary number and its exact Cut counterpart (e.g.,
16,61,27,72,38,83,49,94,05,50).
Because Lal Jodis only represent 20 out of 100 possible pairs, their occurrence is a rare 1-in-5 statistical event. Tracking the interval between Red Jodi declarations across a 60-day historical chart ledger highlights historical consolidation cycles.
4. Frequency Heatmaps & Interval Gap Modeling
One of the most powerful quantitative methods borrowed from financial data science is Interval Gap Modeling:
[Dormant Interval] ──► [Declaration Point] ──► [Current Gap]
   14 Days Gap             Digit '7' Hits          3 Days Since
1. Frequency Distribution Tracking
Create a rolling count table of all 10 single Anks (0 through 9) declared across the last 100 sessions:
- Mean Expected Frequency: In an ideal uniform distribution, each digit should appear approximately 10 times in 100 draws.
- Standard Deviation Boundaries: Real-world distributions typically show high performers appearing 13–15 times and cold numbers appearing 5–7 times.
- Mean Reversion: Extreme outliers (e.g., a digit appearing only twice in 100 sessions) represent high-variance pockets that data analysts study to understand distributional balance.
2. Interval Gap Measurement
Rather than simply looking at how often a digit appears, advanced researchers track the gap length between occurrences:
- Short Gaps: Reappearance within 1 to 3 draws.
- Medium Gaps: Reappearance within 4 to 8 draws.
- Deep Gaps: Absence extending beyond 15 draws.
Documenting gap trends helps prevent the common mistake of assuming a number is "overdue," reinforcing that past gaps do not guarantee immediate appearance.
5. Basic Observation vs. Advanced Technical Analysis
The following comparison illustrates how advanced methodologies differ from casual chart reading:
| Analytical Dimension | Beginner Observation | Advanced Technical Analysis |
|---|---|---|
| Scope of Data | Looks at last 2–3 days | Analyzes 100+ session rolling matrices and multi-month cycles |
| Metric Tracked | Only the central Jodi | Full Open Pana, Close Pana, Single Ank, and Cut alignments |
| Statistical Tool | Intuition or "gut feeling" | Frequency heatmaps, interval gap tracking, and ratio distributions |
| Jodi Classification | Treats pairs as random 2-digit numbers | Groups pairs into 10 Family sets, Red Jodis, and Cut pairings |
| Pana Focus | Often ignores Pana composition | Categorizes Single (SP), Double (DP), and Triple (TP) ratios |
| Risk Perspective | Expects guaranteed outcomes | Acknowledges house edge, independent trials, and manages bankroll strictly |
6. How Sara 567 Empowers Data-Driven Analysts
Modern technical analysis requires clean, unobstructed, and timely historical data. Sara 567 is purpose-built to serve as the premier analytical hub:
- Unbroken Historical Archives: Access comprehensive, date-indexed Jodi Charts and Panel Charts going back months and years without missing records.
- Zero-Latency Live Verification: Fast, real-time result synchronizations across Kalyan, Rajdhani, Milan, and regional markets ensure that data logs remain 100% accurate.
- Responsive Data Tables: Optimized for desktop monitors and mobile devices alike, allowing multi-week chart zooming, column sorting, and clean pattern scanning.
- Educational Integrity: Clear guides on How to Play Satta Matka ensure players understand the mathematical rules without falling prey to unverified rumors.
7. Responsible Gaming & Risk Governance
Advanced analysis should never be confused with financial certainty. To protect your well-being, apply these foundational principles:
- Strict Entertainment Budgeting: Never risk funds required for daily necessities, bills, or family savings. Use our Responsible Gambling Practices framework.
- The 1% Staking Rule: Restrict individual wagers to no more than 1% to 2% of your recreational pool.
- Predefined Stop Limits: Set strict daily loss ceilings and take-profit milestones before opening any chart.
- Underage Prohibition: Market data and educational content are strictly limited to adults aged 18 years and above. Consult our Terms of Service and Disclaimer for regulatory context.
Frequently Asked Questions (FAQ)
What is advanced Matka chart analysis?
Advanced Matka chart analysis is the systematic study of historical market ledgers using statistical tools such as frequency distribution heatmaps, interval gap tracking, Single/Double Pana ratio analysis, and Family Jodi matrices.
Can technical chart analysis guarantee a winning number?
No. No mathematical model, chart pattern, or algorithmic formula can predict or guarantee future outcomes. Every Matka draw is an independent random event governed by fixed mathematical probabilities.
What is a Family Jodi and how is it used in chart analysis?
A Family Jodi is a set of 8 mathematically related two-digit numbers created using Cut Anks (digits separated by a value of 5) and their reversals. Analysts use Family groupings to track symmetry and clustering trends across multi-week chart periods.
What is the difference between Single Pana and Double Pana patterns?
A Single Pana (SP) consists of three unique digits arranged in ascending order (e.g., 137), representing 120 of 220 possible outcomes (~54.5%). A Double Pana (DP) contains two identical digits (e.g., 112), representing 90 combinations (~40.9%). Advanced analysts monitor their distribution ratios over rolling cycles.
What is a Red Jodi (Lal Jodi)?
A Red Jodi is either a pair of identical digits (such as 22 or 77) or a pair formed by a number and its direct Cut counterpart (such as 27 or 72). There are exactly 20 Red Jodis out of 100 possibilities.
Where can I access full historical charts for Kalyan, Milan, and Rajdhani?
Sara 567 hosts comprehensive, verified historical Matka Chart Archives for all premier markets, complete with date stamps, Open/Close Panas, and Jodi summaries.